Visualizations

Analog vs Digital Signals
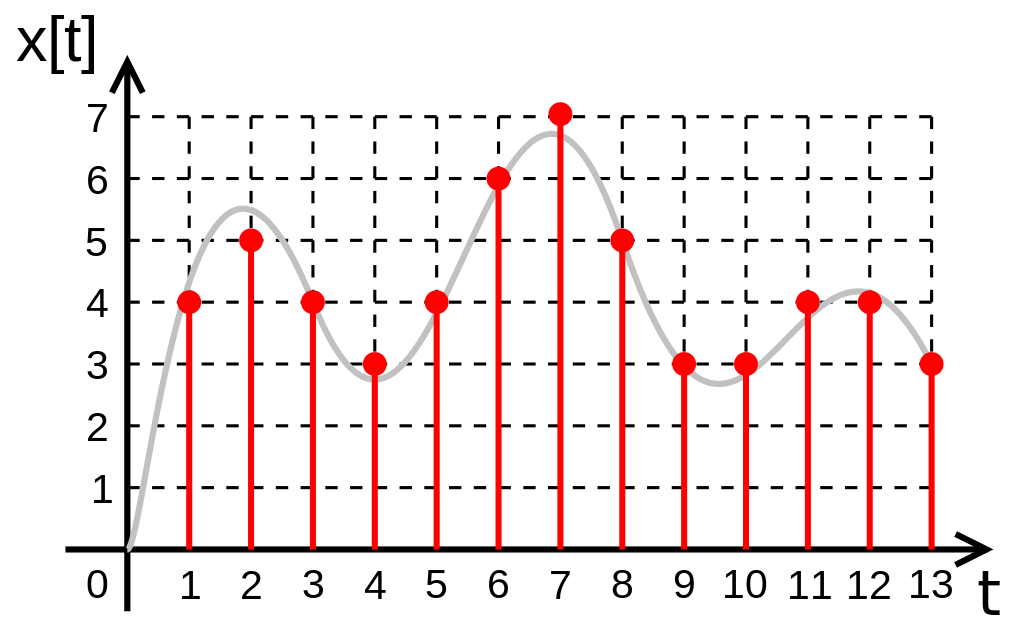
The graph to the left is a visual demonstration of the difference between analog and digital audio data. The x-axis represents amplitude and the y-axis represents time. The black line, the analog signal, is a continuous wave. However, computers can not store analog data. They function using discrete data points, so to put music on computers the continuous waves needed to be approximated at intervals and stored as digital data, the red points on the graph. Functionally, digital audio will always be less data due to its very nature, but the format opens up new ways of manipulating and distributing audio due its inherent discrete qualities.
Compression and the Loudness Wars
One of the more interesting and noticeable changes in audio recording and mastering after the advent of digital technologies is the application of compression to increase loudness. When vinyl and tapes were the main distribution methods, records could only be mastered so loud before the volume would cause the record to skip or tape to distort. While there are still volume distortion problems at high levels with digital music, it is much less a tangible problem. This slider shows the difference in peaks and range between a audio file with and without compression, an audio technique where the quietest parts and loudest parts of a song are evened out. This decreases the dynamic range of the song, and in turn allows the volume to be pushed up farther without risk of distortion. This practice became extremely commonplace in digital music, refferred to as "brick-walling" due the appearance of the final waveform. The technique arguably increases the song's ability to catch people's attention, especially when played back on low-quality speakers or earbuds that do not produce the full dynamic range well, though there is a noticeable loss of fidelity and abrasiveness on higher end gear. The practice may finally be coming to a halt, though, due to steps by iTunes and Spotify to automatically mitigate excessive loudness.
National Public Radio also hosts a helpful infographic about how music has become louder over time: A Visual History of Loudness
A comparison of the dynamic range of uncompressed and compressed audio.
Recording Industry Association Sales and Format Data
Below is data from the RIAA demonstrating how the music market place has changed in format, viewable by sales and revenue. All of the RIAA's data visualizations can be found here: RIAA US Sales Database